
Standard Deviation: Every Investors Need To Know About It
What Is Standard Deviation?
The standard deviation (SD) is a mathematical measurement that investors use to determine the market’s volatility, a specific security, or an investment product’s. It illustrates the extent of variances between distinct values in a dataset and is one of the most common risk gauges that professional and individual investors pay special attention to. Investors would have a deeper understanding of the desired rate of possible returns if the level of risk could be measured.
How Does Standard Deviation Work?
Standard deviation is one of the key parameters used to quantify risk in investments, regardless of what one picks. It’s simple and easy to understand, thus investors and users are informed on a regular basis.Standard deviation is a valuable investment technique since it allows investors to assess securities volatility and, as a result, estimate performance trends. Let’s take an example, if an index fund is sufficiently diversified, it will typically have a low standard deviation just because the fund is striving to replicate the benchmark index. It’s not always the case that an investment with a lower standard deviation is the best alternative. It is contingent on the investor’s willingness to take risks as well as the type of investment. In other words, conservative investors may choose a strategy with lower volatility than the market average, whereas more aggressive investors may not.
The standard deviation is a useful risk indicator, but it isn’t ideal. The standard deviation of a stock’s price reveals to you how much it has varied around in its average price in the previous. As a result, you’ll have a better notion of how dangerous it is. Since the stock only rises and falls a bit, a lower standard deviation is much less risky. As stock prices fluctuate a lot, a higher standard deviation is riskier.
Why Is Standard Deviation Significant?
The risk of an investment deviating from its expected return is measured by the standard deviation. The lower the standard deviation of an investment, the more stable it is. The higher the standard deviation, the more spread the profits will be, and hence the riskier the investment would be. Also, it is important to keep in mind, however, that standard deviation is just one of several risk indicators, and it should not be used as the sole criterion for determining whether a stock is very risky or not dangerous enough.
The Formula for Standard Deviation-
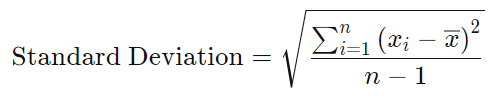
Where:
xi =Value of the ith point in the data set
x= Mean value of the data set
n=The number of data points in the data set
How To Calculate the Standard Deviation?
At first look, the standard deviation formula looks to be somewhat difficult. However, like any other mathematical equation, it may well be split down into separate variables to make things easier to understand.
Step 1: By summing all of the data points and dividing by the number of data points, the mean value is produced.
Step 2: Each data point’s variance is calculated by subtracting the mean from the data point’s value. After that, each of the resulting values is squared, and the results are summed together. After that, the result is divided by the number of data points minus one.
Step 3: The standard deviation is calculated using the square root of the variance (result from step 2).
What Is The Distinction Between Variance And Standard Deviation?
Volatility can also be measured using a variance. The standard deviation shows the value of variation in the same units as the stock, but the variance shows the value in squared units. The square root of the variance is the standard deviation. The mean of a set number of data points is used to calculate variance. Subtract the mean from each separate data point and square the result. After you have gotten those numbers, you will need to figure out what the mean of each square is.
Although both standard deviation and variance are concerned with risk, variance is more difficult to comprehend. Because the results may not even be expressed as effectively as the original data set on the same graph, this is the case.
When contrasted to the mean value, the variance assists in determining the data’s spread size. As the variance increases, higher variation in data values arises, and also the gap between one data value and the next may widen. The variance will be lower if somehow the data values are all near. Moreover, because variances indicate a squared result that might not be properly expressed on the very same graph as the original dataset, they are far more difficult to understand than with the standard deviation. Standard deviations are frequently more straightforward to visualize and utilize. The variance is not always expressed in the same unit of measurement as the data, which isn’t always the scenario with the standard deviation.
Downsides Of Standard Deviation
1. Standard deviation is calculated using historical data, so it does not guarantee future results. An average can vary due to a variety of circumstances, which would throw any estimates off.
2. The standard deviation does not indicate whether a stock’s price is rising or falling. It indicates how far returns deviate from the average, rather than whether future prices will be lower or higher than the average.
3. If standard deviation correctly predicts future stock prices, a stock’s value can nevertheless reach high levels. Outliers are prices that deviate from the norm by a large number of standard deviations(SD). It can occur whenever a stock’s price drops or rises dramatically.
Conclusion
The standard deviation is a useful tool for determining the volatility of a certain asset. This shows how much the asset’s price has fluctuated in the past. The greater the number, the more volatile the market will be. The standard deviation can be used by investors to assess the risks associated with a particular investment. Even though standard deviation can just provide information about previous performance, investors can use it to determine how much risk an asset will contribute to their portfolio. There is no set criterion for what constitutes a decent standard deviation; it all depends on your investment objectives.

